↵
IoMT Service
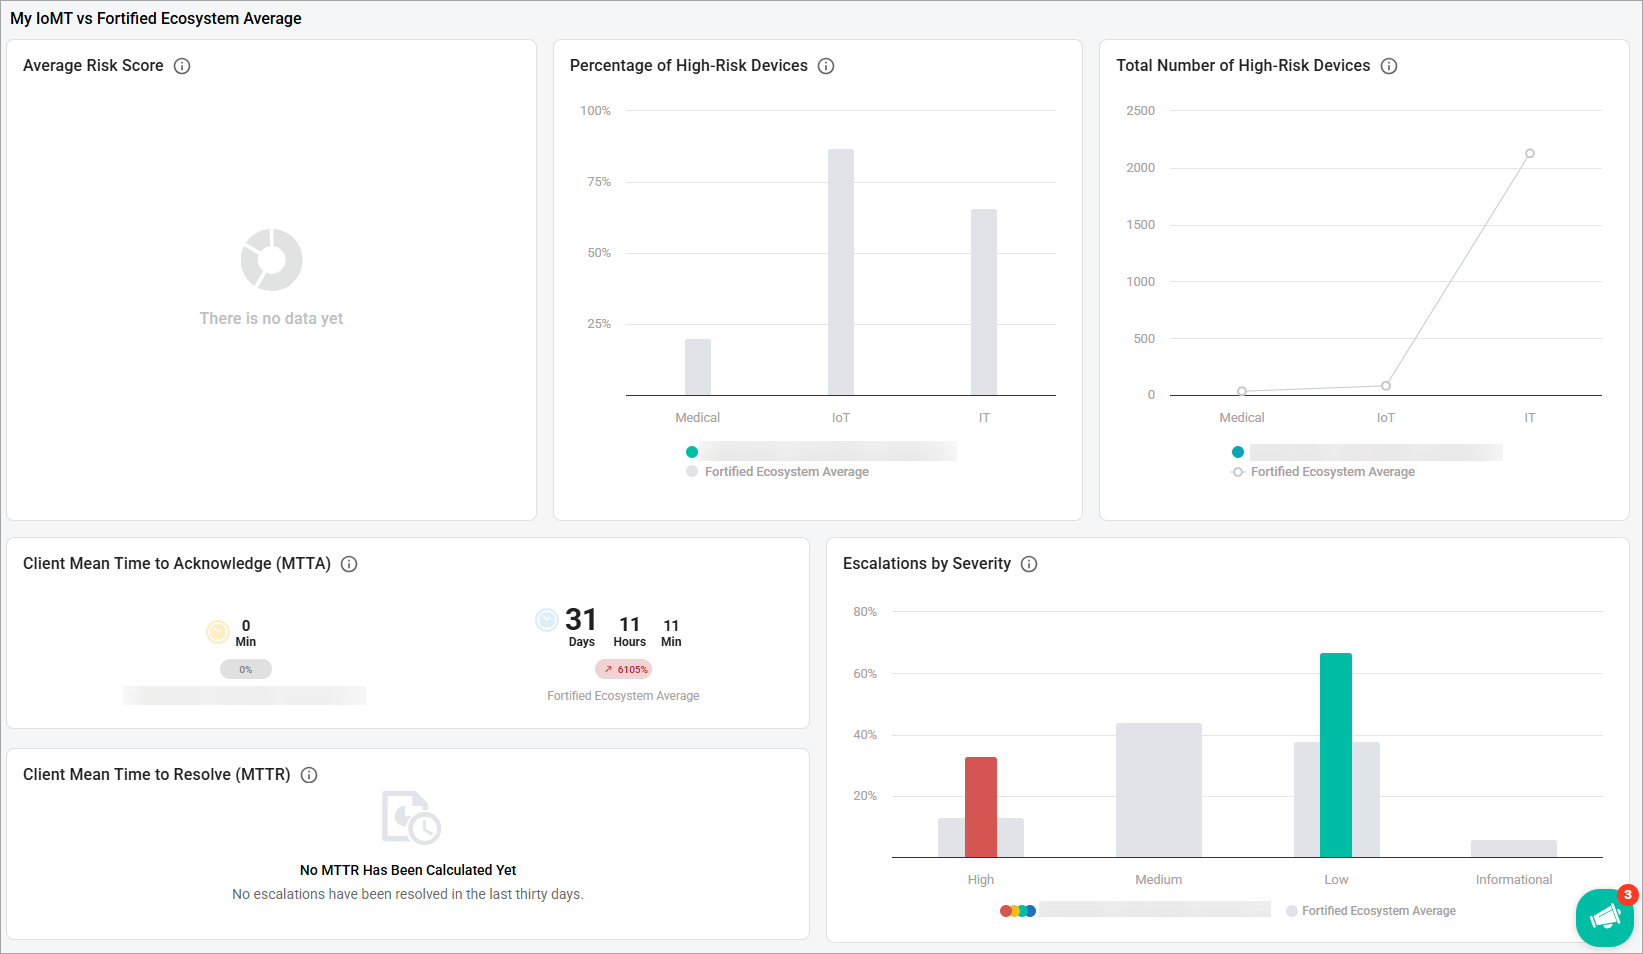
My IoMT vs Fortified Ecosystem Average contains the following data:

- Average Risk Score—shows the average of all your IoMT device risk scores in the last 30 days with a 90-day trend for reference and a comparison of those metrics to the Fortified Ecosystem.
- Percentage of High-Risk Devices—shows the percentage of devices in each category classified as high risk in the last 30 days, along with a comparison to the Fortified Ecosystem.
- Total Number of High Risk Devices—shows the total number of devices classified as high risk in each category in the last 30 days and a comparison of that metric to the Fortified Ecosystem.
- Client Mean Time to Acknowledge (MTTA)—shows your average mean time to acknowledge (MTTA) escalations for the last 30 days, along with a 90-day trend of that datapoint, compared to the average of the same data across the Fortified Ecosystem.
- Client Mean Time to Resolve (MTTR)—shows your average mean time to resolve (MTTR) escalations for the last 30 days, along with a 90-day trend of that datapoint, compared to the average of the same data across the Fortified Ecosystem.
- Escalations by Severity—shows a breakdown by severity of the escalations received in the last 90 days, along with a comparison to the Fortified Ecosystem.
- Note: If the Escalations Only technology was selected during the IoMT service configuration, you will only have access to the Client Mean Time to Acknowledge (MTTA) and Client Mean Time to Resolve (MTTR) metrics.
Related Topics
Marketing Message for Fortified Comparative Analytics service