SIEM Service
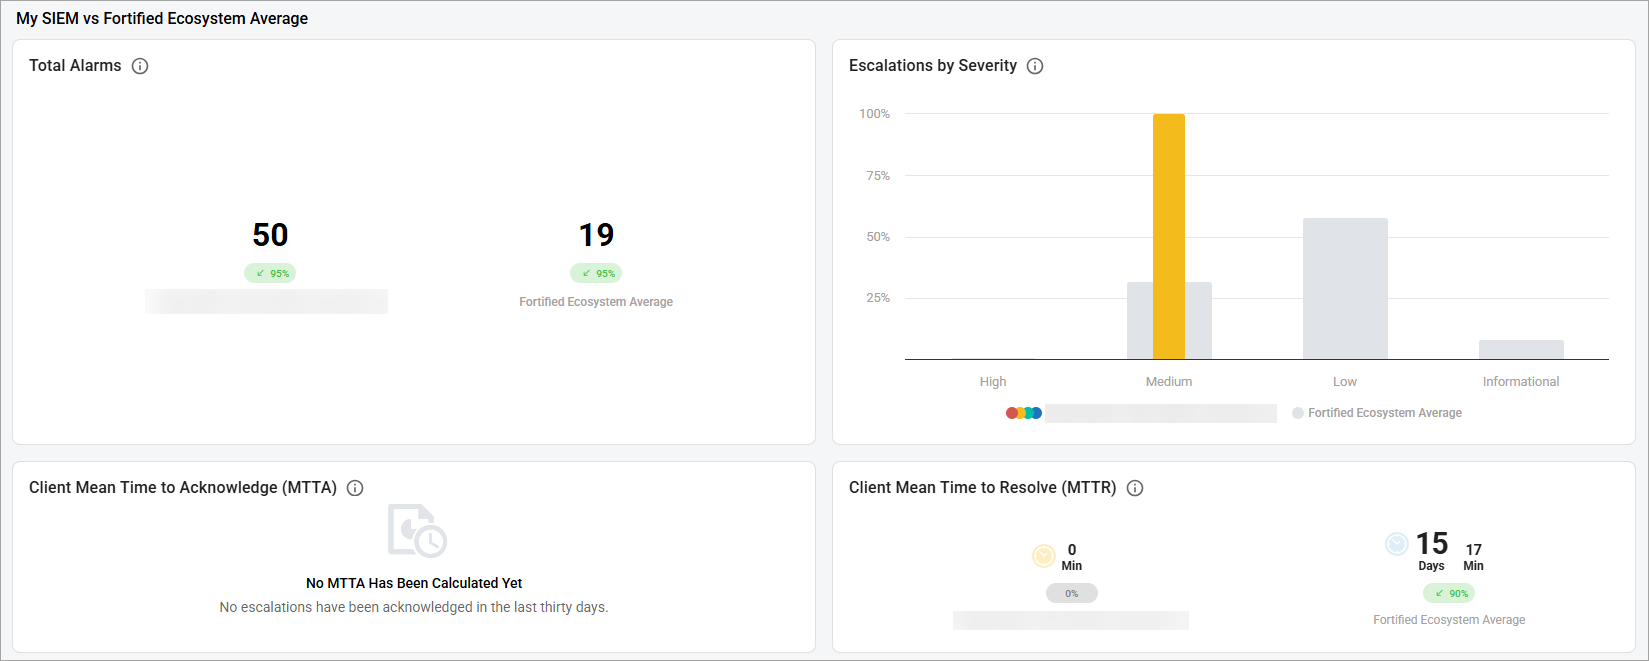
My SIEM vs Fortified Ecosystem Average contains the following metrics:

- Total Alarms—shows the total number of alarms you have received in the last 30 days along with a 90-day trend for reference and a comparison of those metrics to the Fortified Ecosystem.
- Escalations by Severity—shows a breakdown by severity of the escalations received in the last 90 days, along with a comparison to the Fortified Ecosystem
- Client Mean Time to Acknowledge (MTTA)—shows the comparison of your average mean time to acknowledge (MTTA) escalations for the last 30 days, along with a 90-days trend of that datapoint, to the average of the same data across the Fortified Ecosystem.
- Client Mean Time to Resolve (MTTR)—shows the comparison of your average mean time to resolve (MTTR) escalations for the last 30 days, along with a 90-days trend to the average of the same data across the Fortified Ecosystem.
- Note: If the Escalations Only technology was selected during the SIEM service configuration, you will only have access to the Client Mean Time to Acknowledge (MTTA) and Client Mean Time to Resolve (MTTR) metrics.
Related Topics
Marketing Message for Fortified Comparative Analytics service