Escalations by Severity
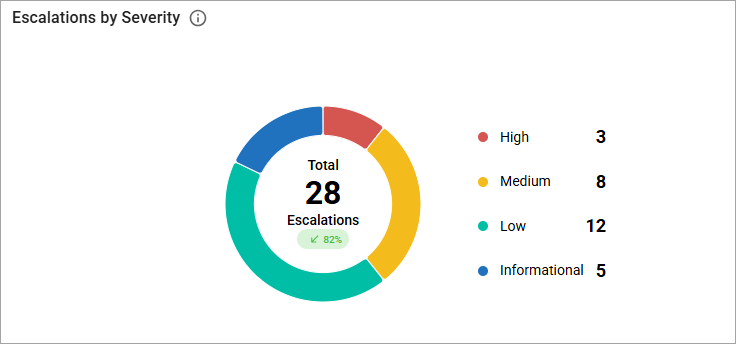
The Escalations by Severity chart shows a breakdown by severity of the escalations received in the last 90 days, along with a comparison to the previous 90 days.

- Note: Each slice of the chart, as well as the High, Medium, Low, and Informational legends with numbers, is clickable. When you select a number, the system redirects you to the EscalationIQ Escalations Tab prefiltered by the corresponding severity, all statuses (Open, In Progress, Closed), and escalations created within the Last 90 days. Selecting the total number in the chart redirects you to the EscalationIQ Escalations Tab filtered by all severities, all statuses, and escalations created within the Last 90 days.
Related Topics
Client Mean Time to Acknowledge (MTTA)
Client Mean Time to Resolve (MTTR)
Escalation Interactions by User